


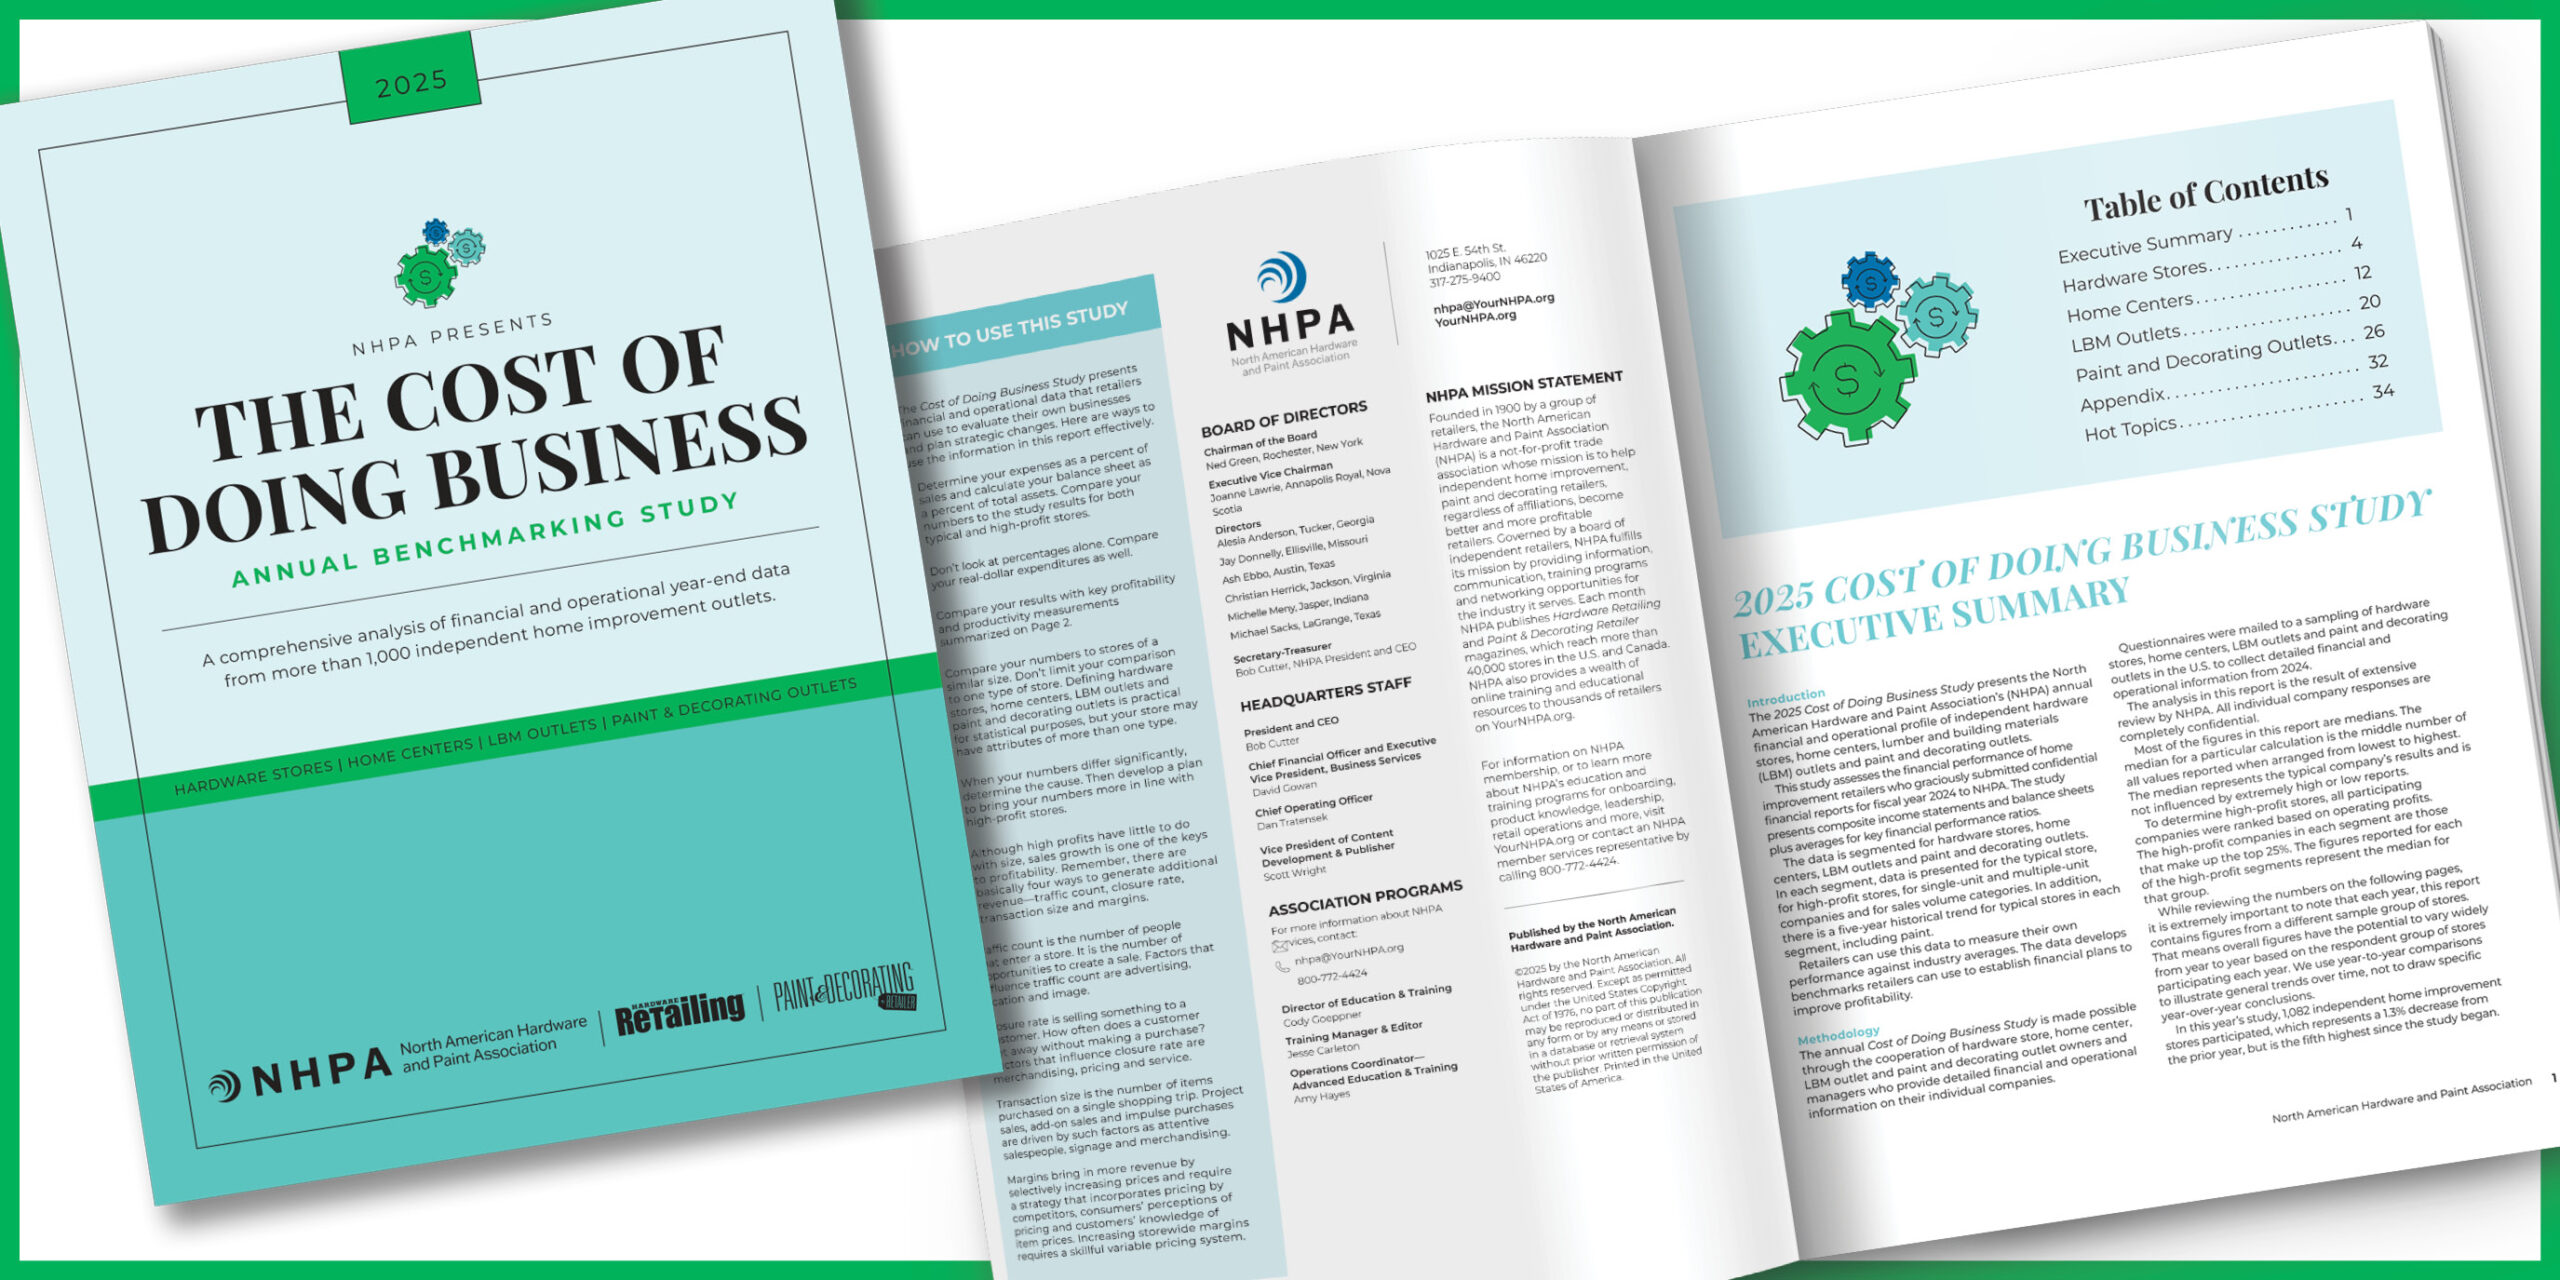
Looking at how fellow independent home improvement operations are performing throughout the year gives retailers in the channel a benchmark to make improvements to their own operations.
Since 2022, the North American Hardware and Paint Association (NHPA) has partnered with The Farnsworth Group to produce the Independent Retailer Index, which tracks key performance metrics quarterly. Every quarter, the index asks independent home improvement retailers to share year-over-year changes in:
• Transaction size and count
• Inventory investment
• Cost of goods
• Profit margin dollars
• Future operational investments
The most recent Independent Retailer Index shares some insight on how retailers are performing amid economic uncertainty. According to the index, which fielded responses from 57 different companies, representing hundreds of independent stores across the U.S., 57% of respondents reported increased year-over-year sales growth, up 29% from Q3 2024 and continuing the upward trend from 2023.
“The data reflects what we are hearing anecdotally from the market,” says NHPA chief operating officer Dan Tratensek. “While sales are managing to stay in positive territory, they have yet to show solid positive momentum. We are also continuing to see sluggishness in transaction counts and significant increases in cost of goods over the last several quarters. We are hopeful that a strong start to 2026 might help break some of these patterns and help the industry gain more traction heading into the months ahead.”
Changes in Total Sales (year over year)
In Q4, 41% of retailers reported higher total sales year over year, up 11 percentage points from last year though down 16 percentage points from last quarter. Average total sales increased 0.6% year-over-year, indicating that growth persisted but at a slower pace than the prior two quarters.
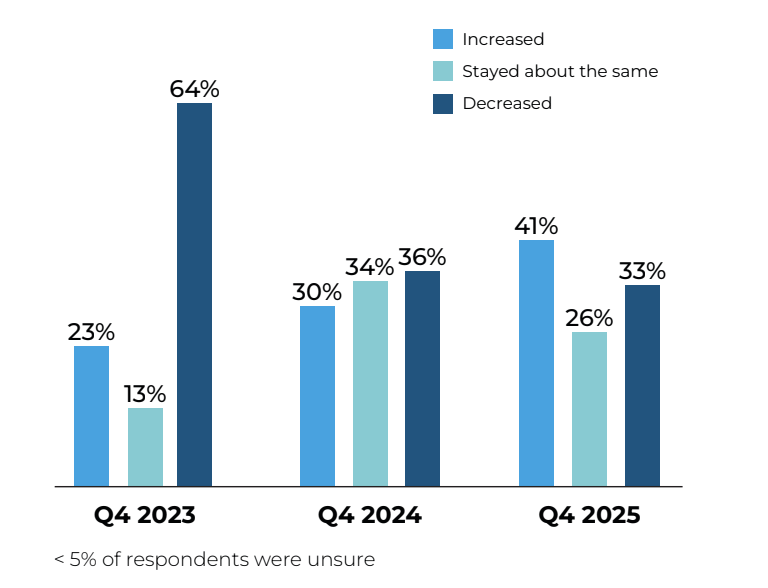
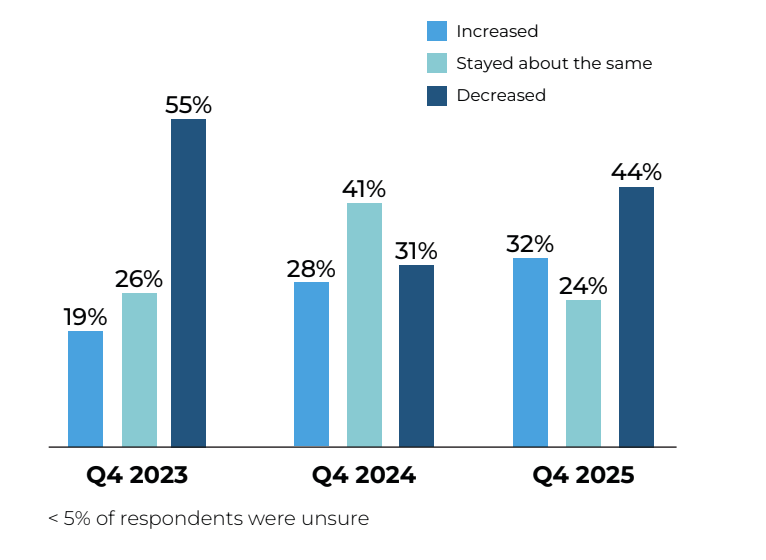
Changes in Transaction Count (year over year)
In Q4, 32% of retailers reported higher transaction counts year-over-year, up 4 percentage points from last year, though below last quarter’s levels. Average transaction count was flat at 0.0% year-over-year, down from modest growth in Q4 last year.
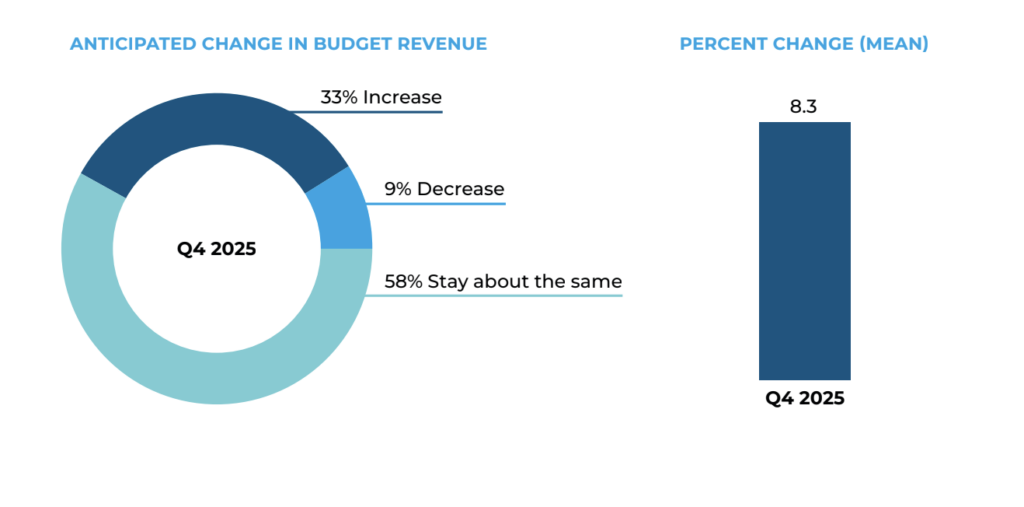
Anticipated Budgeted Revenue Next Year Over This Year
Anticipated budget growth softened in Q4, with fewer retailers planning increases compared to last quarter. The average expected increase of 8.3% held steady from last quarter, indicating that those planning growth remain relatively optimistic.
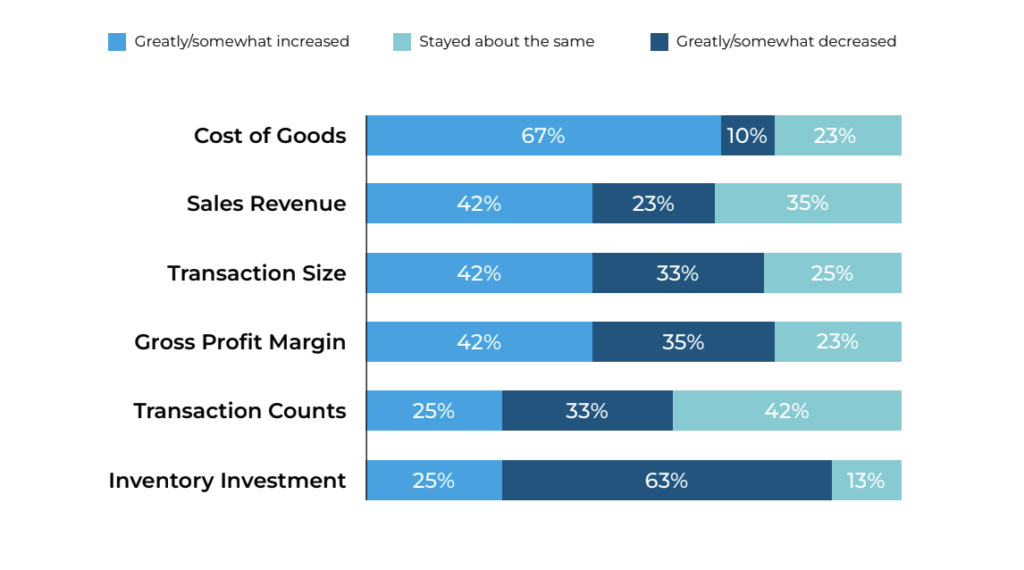
Operations Performance This Year To Date Over the Previous Year
About two thirds of retailers reported higher cost of goods year to date in 2025 compared to 2024, reflecting continued but easing cost pressures relative to earlier in the year. Increases across other operational metrics were reported by a smaller share of retailers, pointing to narrower growth year to date.
Changes in Transaction Size (year over year)
A larger share of retailers reported higher transaction sizes year-over-year, with 42% seeing increases, up 5 percentage points from last year but down from last quarter. Average transaction size increased 0.5% year-over-year, down sharply from both last year and last quarter.
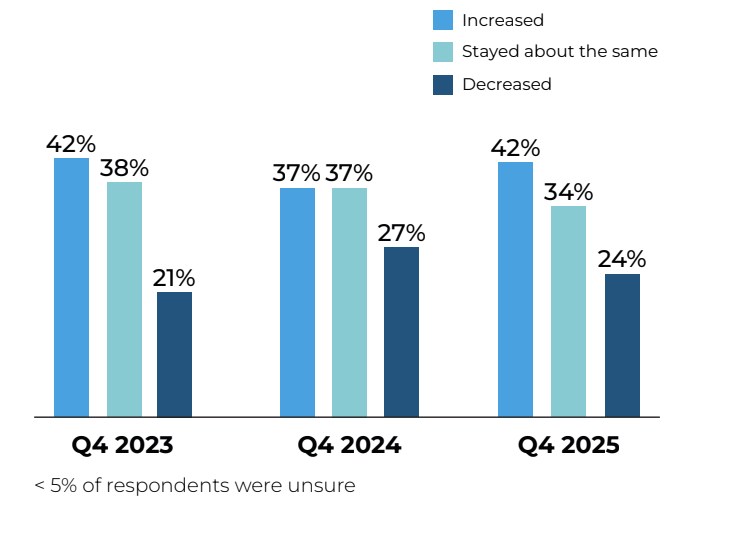
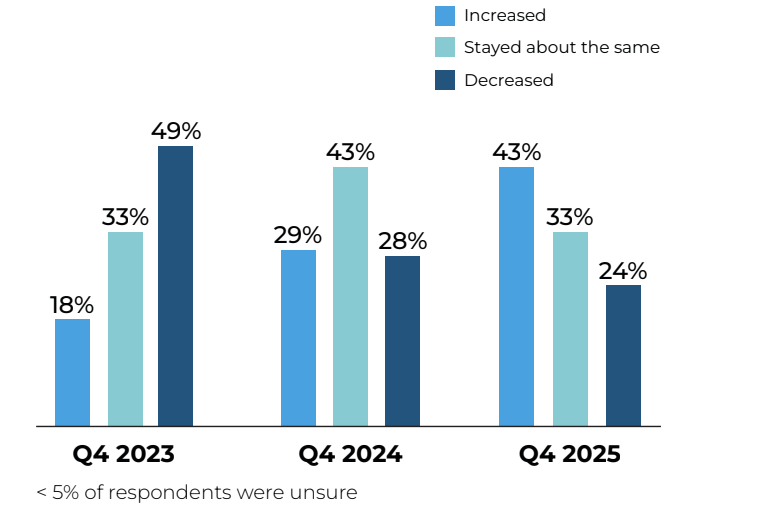
Changes in Gross Profit Margin (year over year)
Gross profit margins showed clearer improvement, with 43% of retailers reporting higher margins year-over-year, up 14 percentage points from last year and the highest share observed in the past two years. Average gross profit margins increased 1.4% year-over-year, up 1 percentage point from a year ago.
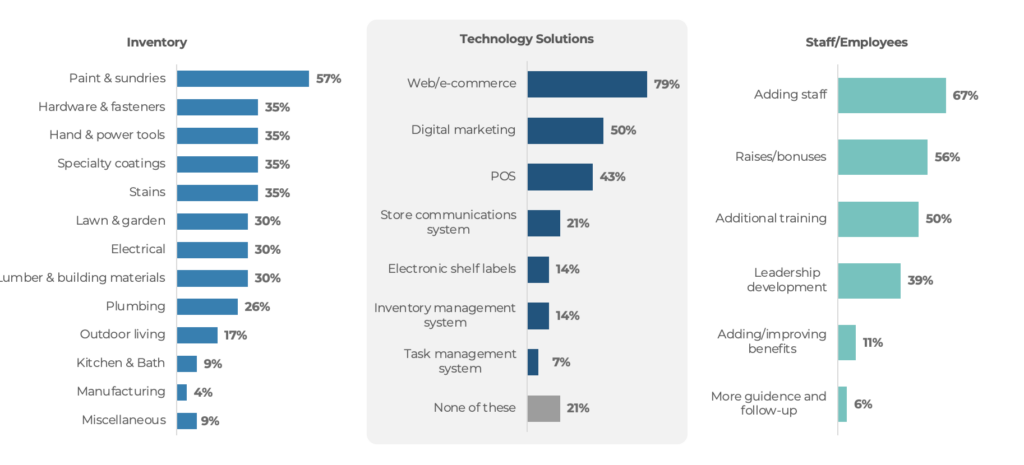
Investment Plans for the Next 12 Months

