

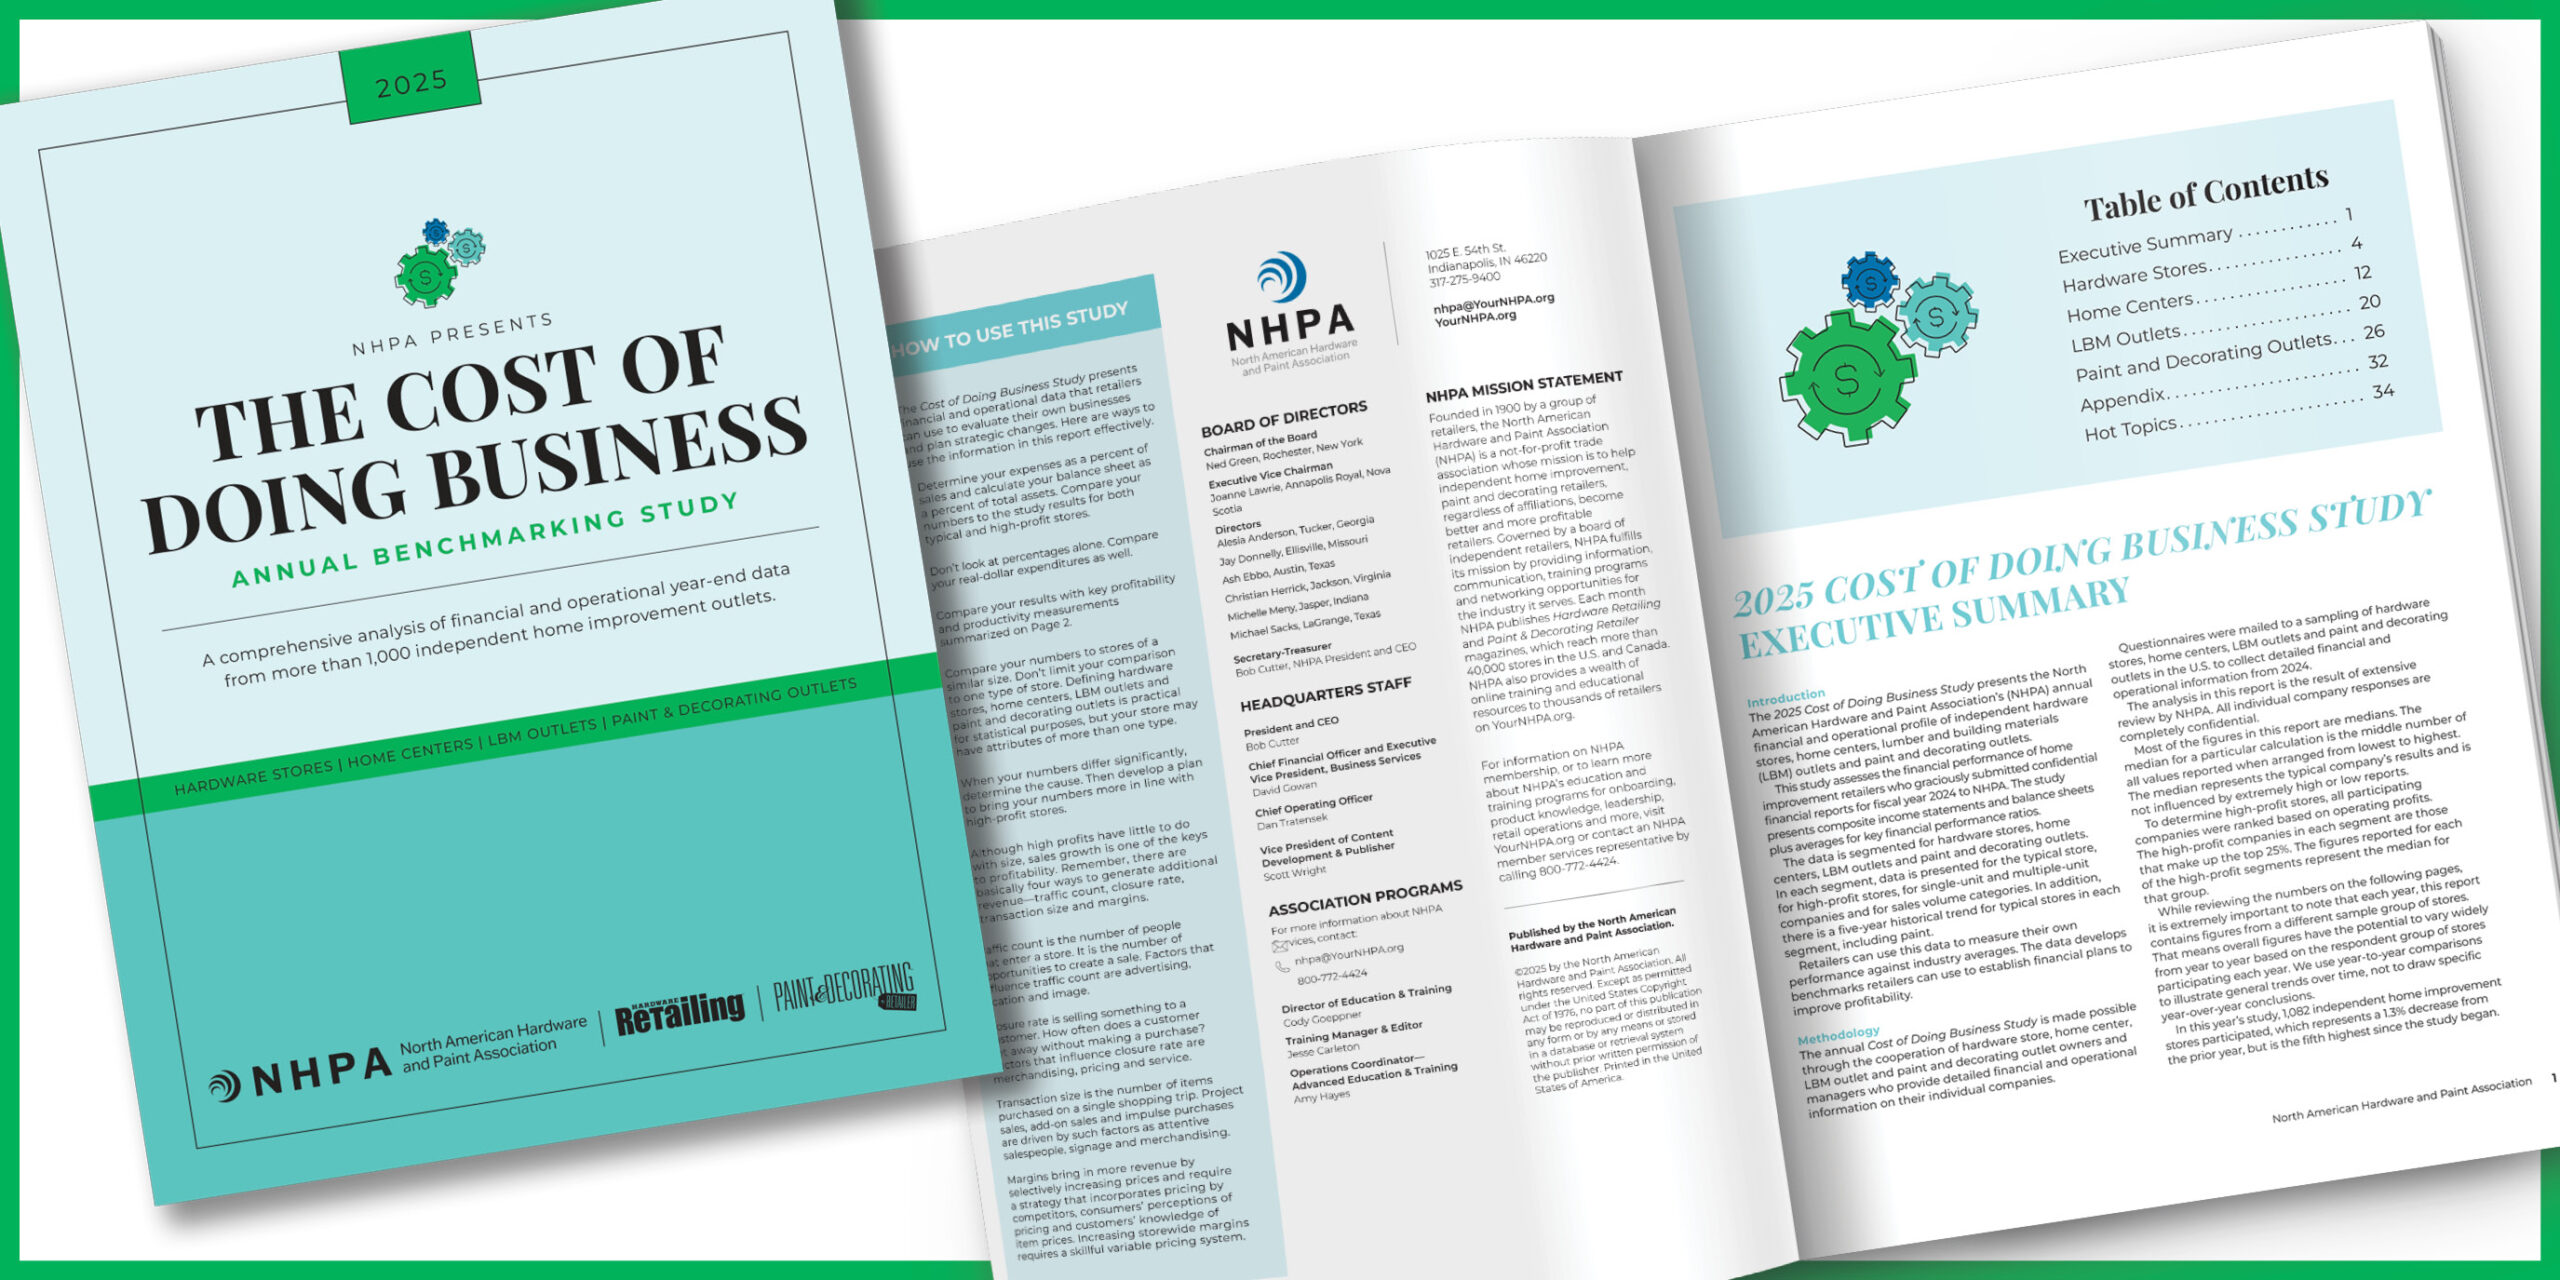
The 2025 Cost of Doing Business Study presents the North American Hardware and Paint Association’s (NHPA) annual financial and operational profile of independent hardware stores, home centers, lumber and building materials (LBM) outlets and paint and decorating outlets.
This study assesses the financial performance of home improvement retailers who graciously submitted confidential financial reports for fiscal year 2024 to NHPA. The study presents composite income statements and balance sheets plus averages for key financial performance ratios.
The data is segmented for hardware stores, home centers, LBM outlets and paint and decorating outlets. In each segment, data is presented for the typical store, for high-profit stores, for single-unit and multiple-unit companies and for sales volume categories. In addition, there is a five-year historical trend for typical stores in each segment, including paint.
Retailers can use this data to measure their own performance against industry averages. The data develops benchmarks retailers can use to establish financial plans to improve profitability.
Methodology
The annual Cost of Doing Business Study is made possible through the cooperation of hardware store, home center, LBM outlet and paint and decorating outlet owners and managers throughout the U.S. who provide detailed financial and operational information on their individual companies.
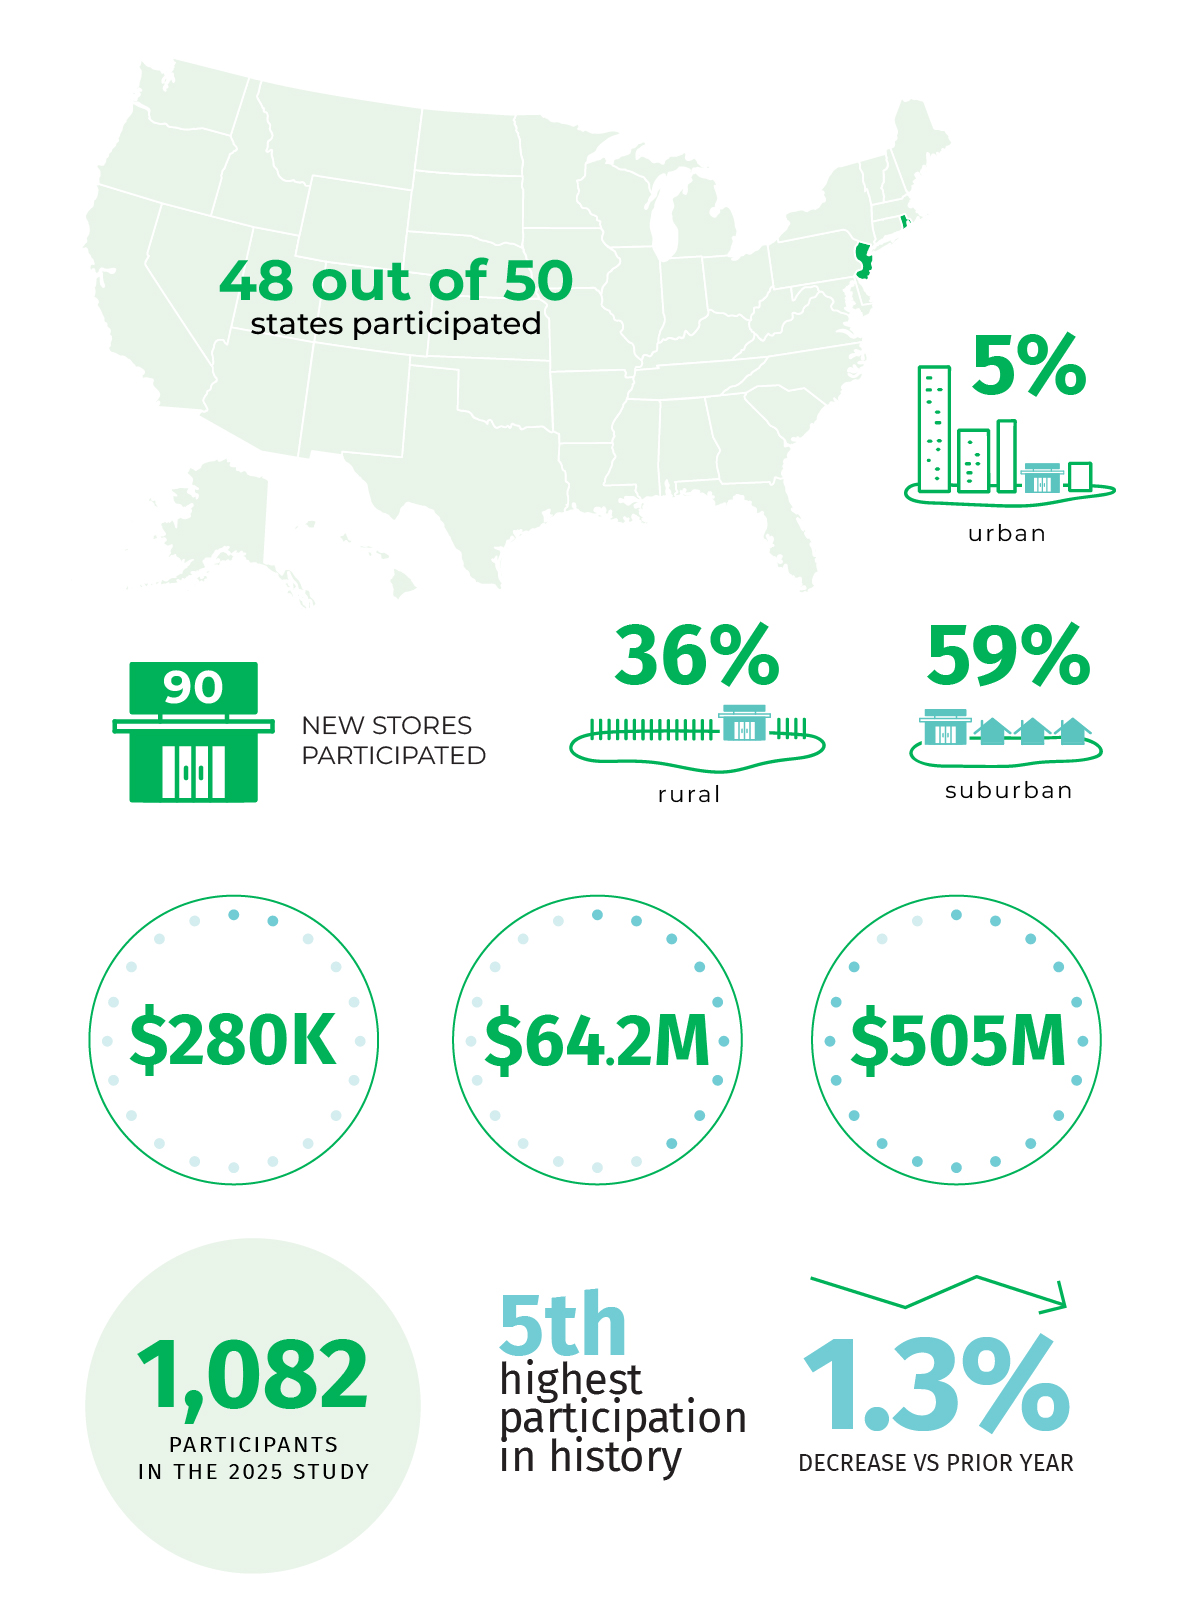
Questionnaires were mailed to a sampling of hardware stores, home centers, LBM outlets and paint and decorating outlets in the U.S. to collect detailed financial and operational information for 2024.
The analysis in this report is the result of extensive review by NHPA. All individual company responses are completely confidential.
Most of the figures in this report are medians. The median for a particular calculation is the middle number of all values reported when arranged from lowest to highest. The median represents the typical company’s results and is not influenced by extremely high or low reports.
To determine high-profit stores, all participating companies were ranked based on operating profits. The high-profit companies in each segment are those that
make up the top 25%. The figures reported for each of the high-profit segments represent the median for that group.
While reviewing the numbers on the following pages, it is extremely important to note that each year, this report contains figures from a different sample group of stores. That means overall figures have the potential to vary widely from year to year based on the respondent group of stores participating each year. We use year-to-year comparisons to illustrate general trends over time, not to draw specific year-over-year conclusions.
In this year’s study, 1,082 independent home improvement stores participated, which represents a 1.3% decrease from the prior year, but is the fifth highest since the study began.
To purchase the 2025 Cost of Doing Business Study, visit YourNHPA.org/CODB.
Hardware Store Highlights
Sales Per Customer of $39 is an all-time high
Profit Before Taxes of 4.7% dropped for the third year in a row but is the fifth highest on record
Gross Margin After Rebate of 42.6% is the highest since 2016
Home Center Highlights
Comp Sales were down 1.18%
Inventory Turnover (2.0) and Sales Per Inventory (2.9) are the lowest levels ever recorded
Typical store Gross Margin After Rebate of 32.4% is the same as the prior year
LBM Outlet Highlights
Comp Sales were up 1.57%
Purchase Rebates of 2.0% is the highest ever recorded
Sales Per Employee of $521,494 is the third highest since the study began
Paint Outlet Highlights
Owners’ Salary (0.4%) is the lowest since the paint segment became part of the study
Comp Sales were down more than any other segment at 2.22%
Employee Headcount is up +2, the highest level since 2020
Hot Topics Highlights
E-Commerce and Delivery: Average percentage of sales online across all segments was 2% and the median was 1%
Inventory and Loss Prevention: Shrink expense as a percent of sales across all segments was an average of 1.7% and median of 1%
Staff and Wages: Employee Turnover across all segments was at an average of 28.4% and median of 27%
How to Use This Study
The Cost of Doing Business Study presents financial and operational data for you to evaluate your business and plan strategic changes. Here are ways you can use this report.
Determine your expenses as a percent of sales and calculate your balance sheet as a percent of total assets. Compare your numbers to the study results for both typical and high-profit stores.
Don’t look at percentages alone. Compare your real-dollar expenditures as well.
Compare your results with key profitability and productivity measurements summarized.
Compare your numbers to stores of a similar size. Don’t limit your comparison to one type of store. Defining hardware stores, home centers, LBM outlets and paint and decorating outlets is practical for statistical purposes, but your store may have attributes of more than one type.
If your numbers differ significantly, determine the cause. Then develop a plan to bring your numbers more in line with high-profit stores.
“The CODB allows retailers to see direct results between their income statement and balance sheet versus the rest of the industry. They can use the ratios included in the study to guide a plan for revenue growth and to help cut expenses.”- Dave Gowan, NHPA Chief Financial Officer


